Core Web Vitals: Measure, Interpret, Business Impact

AI summary
- Core Web Vitals comprise three metrics: LCP measuring loading speed up to 2.5 seconds, INP measuring responsiveness up to 200 milliseconds, and CLS measuring layout stability up to 0.1, each evaluated at the 75th percentile.
- Only 45 percent of desktop and 38 percent of mobile home pages achieve good Core Web Vitals globally, while secondary pages perform better at 61 percent desktop and 51 percent mobile.
- Vodafone's A/B test showed a 31 percent LCP improvement generated 8 percent more sales, while Renault found one second better LCP correlated with 14 percentage point less bounce and 13 percent more conversions.
- Slow pages reduce Google Ads Quality Score affecting cost per click, and slow server response times reduce Google's crawl capacity, causing less frequent indexing of site changes.
Generated with AI, the details are in the article.
Table of contents
You probably know the situation: marketing has known for months that the website is slow. IT has other priorities. And headquarters asks for proof before it releases budget. Where does it say that poor Core Web Vitals cost traffic? How big is the effect? Why should this matter more than the next feature?
This article delivers the answers with sources. It shows how to measure Core Web Vitals correctly, how strongly they really influence rankings, and where the actual business lever sits: less in rankings, more in conversion, ad costs and crawling. And it says honestly where the chain of evidence is thin.
Go to the CWV business calculator
What Core Web Vitals are and how Google measures them
Core Web Vitals are three metrics Google uses to rate the user experience of a page: Largest Contentful Paint (LCP) measures how quickly the largest visible element has loaded. Interaction to Next Paint (INP) measures how quickly the page responds to clicks and input. Cumulative Layout Shift (CLS) measures how much content jumps around while loading. Each metric has a threshold for "good", and Google does not rate the average but the 75th percentile of all page loads. Three out of four visitors must stay below the threshold, otherwise the page fails.[4]
| Metric | Good | Needs improvement | Poor |
|---|---|---|---|
| LCP (loading) | up to 2.5 s | 2.5 to 4.0 s | over 4.0 s |
| INP (responsiveness) | up to 200 ms | 200 to 500 ms | over 500 ms |
| CLS (stability) | up to 0.1 | 0.1 to 0.25 | over 0.25 |
Since 12 March 2024, INP has been the official interaction metric, replacing First Input Delay (FID).[5] If your reports still show FID values, you are measuring a metric Google no longer uses.
The data source is the Chrome UX Report (CrUX). It is the official dataset of the Web Vitals program: real Chrome users, rolling 28 days, evaluated per URL and per origin. Google itself states that Search uses this dataset to determine the page experience ranking factor.[7] Field data is never a single number but a distribution: some users experience the page as fast, others as very slow.[6]
Where the web stands
The HTTP Archive evaluates CrUX data for millions of websites. In the Web Almanac 2024, only 45 percent of home pages on desktop and 38 percent on mobile achieve good Core Web Vitals. Secondary pages do better: 61 percent on desktop, 51 percent on mobile.[14] For Time to First Byte, the server's response time, only 55 percent of desktop sites and 44 percent of mobile sites are in the green range in 2025.[15]
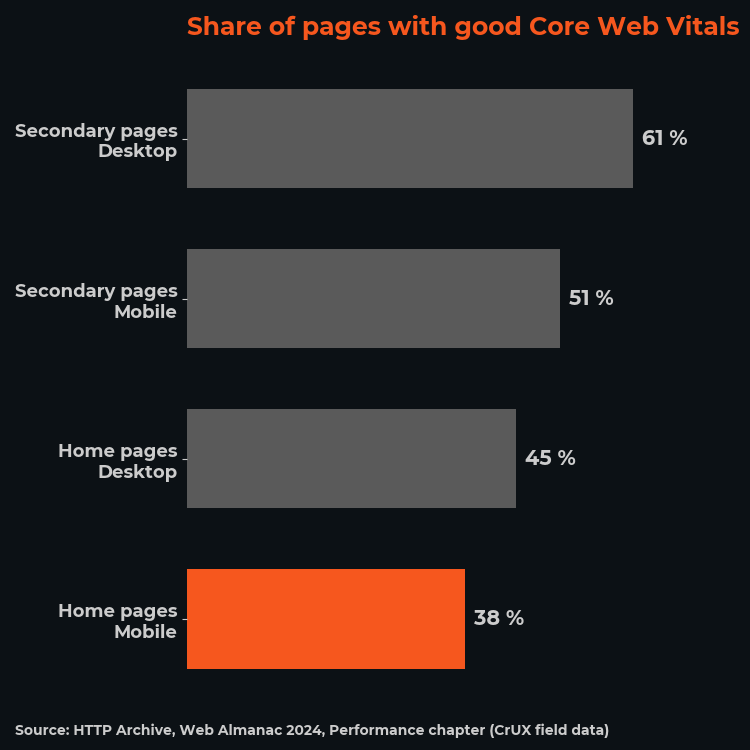
The majority of mobile home pages fail the test. For you, that is both consolation and opportunity: whoever passes stands out from the majority.
Field or lab: why your PageSpeed score is not your Core Web Vitals status
The most common mistake in discussions with IT and management: someone opens PageSpeed Insights, sees a performance score of 85 and concludes that everything is fine. That score comes from Lighthouse, a simulated single measurement under fixed lab conditions. It is a grade for one test run, not a statement about your users.[6]
| Lighthouse audit (version 10) | Weight in score |
|---|---|
| First Contentful Paint | 10 % |
| Speed Index | 10 % |
| Largest Contentful Paint | 25 % |
| Total Blocking Time | 30 % |
| Cumulative Layout Shift | 25 % |
Two things stand out. First: 30 percent of the score depends on Total Blocking Time, a metric Google does not use in ranking at all. Second: INP, the real interaction metric, does not appear in the score because it can only be measured with real users.[8] A score of 90 and a CWV status of "poor" are therefore not mutually exclusive. Both at the same time is actually common, for example when the page looks good in the lab on a fast server but real users arrive over slow mobile networks.
Search Console, on the other hand, shows the status that counts for Google. It groups similar URLs and rates each group by its worst metric: good LCP plus poor CLS equals "poor". If a group has too little data, it falls back to an origin group for the whole domain.[9]
How to measure correctly in four steps
- Search Console, Core Web Vitals report. Mobile and desktop separately. This is the status Google sees, broken down by URL group.[9]
- PageSpeed Insights, top block "Discover what your real users are experiencing". These are the CrUX field data for the tested URL and for the origin. Read the Lighthouse score below only as a diagnostic, not as a KPI.[6]
- CrUX API or CrUX Dashboard. When you need values without a login and for competitors. Origin values exist for every domain with enough traffic, not only yours.[7]
- Your own Real User Monitoring. CrUX tells you that there is a problem. Your own RUM setup tells you on which templates, in which countries and on which devices.[6]
Four typical misinterpretations
- "Score 90, so everything is fine." The score is lab. The status is field. Only the status counts.
- "I just tested it myself, it loads fast." A test on the office Wi-Fi on a current laptop is the best condition your page will ever get. The 75th percentile of your users looks different.
- "The home page is optimised." Revenue and leads are generated on product, application and campaign pages. They have their own templates and their own values.
- "Desktop is green." Google rates mobile and desktop separately. A B2B audience is often desktop-heavy, but the mobile status is still a separate finding with its own consequence.
Visibly AI: your SEO copilot
Projects, rankings, Search Console data and a copilot that runs the analysis for you. Start for free.
How strongly Core Web Vitals really influence rankings
Here it is worth quoting Google verbatim, because both halves of the quote tend to get dropped in discussions. The official page experience documentation says:
"Core Web Vitals are used by our ranking systems. We recommend site owners achieve good Core Web Vitals for success with Search and to ensure a great user experience generally. Keep in mind that getting good results in reports like Search Console's Core Web Vitals report or third-party tools doesn't guarantee that your pages will rank at the top of Google Search results."
Google Search Central, Understanding page experience in Google Search results[1]
In plain terms: Core Web Vitals are a ranking signal, but not a free pass. The page experience signals have been active in ranking since May 2021 and combine Core Web Vitals with mobile-friendliness, HTTPS and the rules for intrusive interstitials.[3] In 2023, Google clarified that the helpful content system also considers page experience signals "to a degree", while primarily focusing on content signals.[2]
My assessment from practice: Core Web Vitals act as a tiebreaker. Between two pages of similar relevance, the one with the better user experience wins. That sounds like little, but it is a lot in exactly those markets where content is interchangeable. When four manufacturers explain the same product with the same standards, data sheets and application descriptions, "similar relevance" is not the exception but the norm. Then the tiebreaker decides regularly, and systematically against the slowest site.
Equally honest: content, search intent and internal linking weigh more. A page that does not answer the user's question is not saved by a 2.0 second LCP. Anyone who sells Core Web Vitals as the sole lever loses credibility at IT's first fact check.
Why they are still business-critical: the conversion evidence
The strongest evidence for Core Web Vitals does not come from rankings but from how users behave after the click. And here the data is unusually dense, because Google has been publishing case studies with company figures since 2020.
The cleanest proof comes from Vodafone with an A/B test: a landing page optimised for Web Vitals with 31 percent better LCP generated 8 percent more sales, 15 percent more leads per visit and 11 percent more cart views per visit.[17] An A/B test rules out the usual objection that fast sites simply belong to the better companies.
For B2B and lead generation, Renault is the most relevant study: 10 million visits in 33 countries over four months, measured on landing pages. One second of better LCP correlated with 14 percentage points less bounce and 13 percent more conversions, measured as completed lead forms.[18] Farfetch confirmed the 2.5 second threshold statistically: above it, conversion rate drops on average by 1.3 percent for every additional 100 milliseconds of LCP, and exit rate drops by 3.1 percent for every 0.01 less CLS.[19]
| Company | What improved | Result | Source |
|---|---|---|---|
| Vodafone | LCP -31 % (A/B test) | Sales +8 %, lead-to-visit +15 % | [17] |
| Renault | LCP -1 s | Bounce -14 pp, conversions +13 % | [18] |
| Farfetch | LCP, CLS | CVR -1.3 % per 100 ms LCP above 2.5 s | [19] |
| Swappie | LCP -55 % | Mobile revenue +42 %, relative mobile CVR from 24 % to 34 % | [20] |
| Yahoo! JAPAN News | CLS -0.2 | Page views per session +15.1 %, session duration +13.3 % | [21] |
| redBus | INP | Sales +7 % | [22] |
| The Economic Times | LCP p75 from 4.5 s to 2.5 s | Bounce rate -43 % | [23] |
| Tokopedia | TTI -4 s | CTR +35 %, CVR +8 % | [24] |
| Nikkei | PWA relaunch, Lighthouse 23 to 82 | 2.3x organic traffic, conversions +58 % | [25] |
Broader studies add to this. In 2020, Google and Deloitte evaluated mobile data from retail, travel, luxury and lead generation in Europe and the US for "Milliseconds Make Millions": an improvement of just 0.1 seconds went along with 8.4 percent more retail conversions, 10.1 percent more travel conversions and 8.3 percent less bounce on lead generation information pages.[16] The BBC, by its own account, loses 10 percent of its users for every additional second of load time.[26] And the often quoted Google figure that 53 percent of mobile users abandon a page that takes longer than three seconds to load still appears in Google's own case studies today.[25]
Specifically for B2B, Portent evaluated load time against goal conversions in 2022: around 40 percent at one second, 34 percent at two, 29 percent at three seconds, and above five seconds roughly half the conversion rate of a fast site.[27] The absolute values depend on Portent's dataset, the curve is what matters: the steepest drop lies between one and three seconds, exactly the range the LCP threshold covers.
Two more levers: paid search efficiency and crawling
Slow pages cost twice. The first hidden item sits in the Google Ads account. Quality Score is made up of three components: expected click-through rate, ad relevance and landing page experience, each rated in comparison with other advertisers for the same search.[10] In its recommendations for improving landing page experience, Google explicitly says: "Improve loading speed. The speed at which your page loads can be the difference between someone bouncing or buying."[11] Quality Score feeds into ad rank and thus into cost per click. A slow landing page therefore pays more for the same position than a fast one, on every single click.
The second item is crawling. Google calculates a crawl capacity limit for every website. The documentation states: if response times including Time to First Byte remain stable or improve, the limit goes up. If the site slows down, it goes down and Google crawls less.[12] For large sites with many product pages and country versions, this decides how quickly changes reach the index.
Then there is rendering. Google processes JavaScript pages in three phases, crawling, rendering and indexing, and queues pages for rendering separately.[13] A page whose text only comes into existence in the browser is at a double disadvantage: the user waits for LCP, and Googlebot waits in the render queue. Server-side rendering solves both with one measure. How much text your page already delivers in the server HTML is something my free Server-Side Rendering and JavaScript SEO Checker shows you in a minute. My assessment, without a source, from practice: what Googlebot first has to render, many AI crawlers never see at all because they do not execute JavaScript. Anyone who wants to be visible in AI search has one more argument for server-side rendering.
How to build the business case in five steps
- Baseline from field data. CrUX values for the origin and for the three to five revenue-relevant templates, mobile and desktop separately, with a date. No Lighthouse scores.[7][9]
- Benchmark with the same method. Measure two or three competitors on the same day with the same tool. A factor of 3 in mobile LCP against the market leader is an argument every headquarters understands.
- Separate the cause. Is the gap before the first byte (server, rendering, hosting) or after it (fonts, scripts, images, cookie banner)? The answer determines whether quick wins are enough or the delivery itself has to change. Check the rendering share with the SSR Checker, and TTFB with CrUX field data.[12][13]
- Phrase targets as thresholds. "Out of poor within six months, then good" is measurable and cannot be argued away. "Get faster" can.[4]
- Sensitivity calculation, not forecast. Take published multipliers and calculate a range, clearly marked as a worked example.[18][19][27]
Worked example (fictional): A B2B website has 20,000 visits per month on product and application pages, a mobile LCP of 5 seconds and a lead rate of 1 percent, that is 200 enquiries. Applying the Renault multiplier, 13 percent more conversions per second of better LCP, a one-second improvement would correspond to 26 additional enquiries per month.[18] According to Farfetch, 1.3 percent per 100 milliseconds, the same second would yield around 12 percent, that is 24 enquiries.[19] Two independent datasets, the same order of magnitude. That is not a forecast for your site, but a robust range for a decision.
Run the numbers for your own website
Enter your figures and drag the slider to your LCP target. The calculation uses +13 percent conversions per second of faster LCP, the value Renault and Farfetch arrive at independently. Worked example, not a forecast.
Conversion rate
Conversions per month
Value per month
Rule: +13 % conversions per second of faster LCP, linear, no compounding. Sources: Renault [18], Farfetch [19].
Case examples from the studies, applied to your figures
| Study | Rule | Effect | additional conversions | additional value | Source |
|---|---|---|---|---|---|
| Renault | +13 % per 1 s faster LCP | [18] | |||
| Farfetch | +1.3 % per 100 ms, only above 2.5 s | [19] | |||
| Vodafone | +8 % per 31 % relative LCP improvement | [17] | |||
| Deloitte | +8.4 % for the first 0.1 s | [16] |
What you should not do: put the Lighthouse score as a KPI in the monthly report, phrase a revenue forecast as a promise, or take the home page as the benchmark. All three mistakes cost you credibility at the first fact check, and you need that credibility for the next six months.
Conclusion
Core Web Vitals are not a ranking hammer, but a reliable amplifier. They decide ties in rankings, they change the price of every paid click, they determine how much Google crawls, and they set how many visitors make it to the first interaction at all.
- Measure in the field, not in the lab. Search Console and CrUX show the status that counts for Google. The PageSpeed score is a diagnostic tool.
- Interpret honestly. Tiebreaker in rankings, lever for conversion, ad costs and crawling. Promise more and you lose IT as a partner.
- Build the case from field data, benchmark and published multipliers. Thresholds as targets, sensitivity calculation instead of forecast, monthly report.
Sources
- Google Search Central – Understanding page experience in Google Search results, FAQ "What aspects of page experience are used in ranking?". Retrieved 8 September 2026. developers.google.com
- Google Search Central Blog – The role of page experience in creating helpful content, April 2023, updates through 12 March 2024. developers.google.com
- Google Search Central Blog – Timing for bringing page experience to Google Search, 10 November 2020, update June 2021. developers.google.com
- web.dev – Web Vitals: metrics and thresholds (LCP 2.5 s, INP 200 ms, CLS 0.1, 75th percentile). web.dev
- web.dev Blog – Interaction to Next Paint is officially a Core Web Vital, 12 March 2024. web.dev
- web.dev – Why lab and field data can be different (and what to do about it). web.dev
- Chrome for Developers – Chrome UX Report (CrUX) overview. developer.chrome.com
- Chrome for Developers – Lighthouse performance scoring, Lighthouse 10 weighting. developer.chrome.com
- Search Console Help – Core Web Vitals report. support.google.com
- Google Ads Help – About Quality Score for Search campaigns. support.google.com
- Google Ads Help – 5 ways to use Quality Score to improve your performance, section "Consider updating your landing page". support.google.com
- Google Search Central – Crawl Budget Management, section "Crawl capacity limit". developers.google.com
- Google Search Central – Understand JavaScript SEO basics, section "How Google processes JavaScript". developers.google.com
- HTTP Archive – Web Almanac 2024, Performance chapter, Core Web Vitals section (Figure 9.4), 11 November 2024. almanac.httparchive.org
- HTTP Archive – Web Almanac 2025, Performance chapter, TTFB (Figure 7.5), 15 January 2026. almanac.httparchive.org
- Deloitte Digital with Google – Milliseconds Make Millions, 2020. deloitte.com
- web.dev case study – Vodafone: A 31% improvement in LCP increased sales by 8%, 17 March 2021. web.dev
- web.dev case study – How Renault improved its bounce and conversion rates by measuring and optimizing Largest Contentful Paint. web.dev
- web.dev case study – Luxury retailer Farfetch sees higher conversion rates for better Core Web Vitals. web.dev
- web.dev case study – How Swappie increased mobile revenue by 42% by focusing on Core Web Vitals. web.dev
- web.dev case study – How CLS optimizations increased Yahoo! JAPAN News's page views per session by 15%. web.dev
- web.dev case study – How redBus improved their website's Interaction to Next Paint (INP) and increased sales by 7%. web.dev
- web.dev case study – How The Economic Times passed Core Web Vitals thresholds and achieved an overall 43% better bounce rate. web.dev
- web.dev case study – How focusing on web performance improved Tokopedia's click-through rate by 35%. web.dev
- web.dev case study – Nikkei achieves a new level of quality and performance with their multi-page PWA (contains the Google figure "53% of mobile users abandon after 3 s"). web.dev
- web.dev – Why does speed matter? (BBC: 10% of users lost per additional second). web.dev
- Portent – Site Speed is (Still) Impacting Your Conversion Rate, updated 20 April 2022. portent.com
Brand Radar: where does your brand stand?
Brand and generic traffic, competitors and potential at a glance, free of charge.

About the Author: Antonio Blago
SEO Freelancer & AI Visibility Expert
I optimize SEO data-driven with Python, behavioral psychology, and my Neuro-SEO System®. On YouTube, LinkedIn, and Instagram I share hands-on tutorials, insights, and SEO strategies.