Stock Visualization with Tableau
Tableau is a great Business Intelligence Tool to build dashboards fast and embed them into your web page. Below
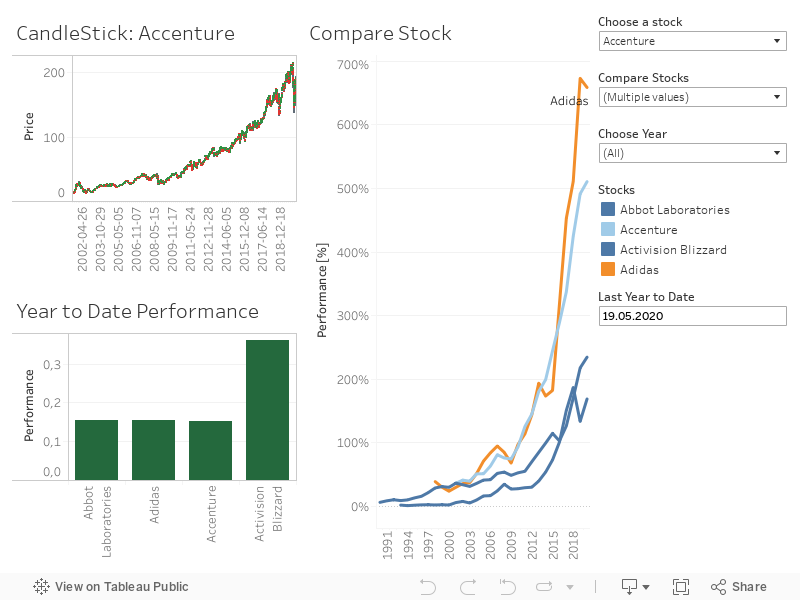
is an example with stock data, where I prepared the data in python and aggregated them in Tableau. If you want
try out Tableau, you can download the free version of tableau, which is called Tableau Public
How to learn Python?
If you want to learn about how to code with python, check out this book:

How to learn Tableau?
If you want to learn about how to build nice visualizations with Tableau, check out this book:

Stock Visualization